As part of his job as a children's worker, my father spends the summer running camps in the Dursley countryside, in bell tents which sleep about 7 people each.

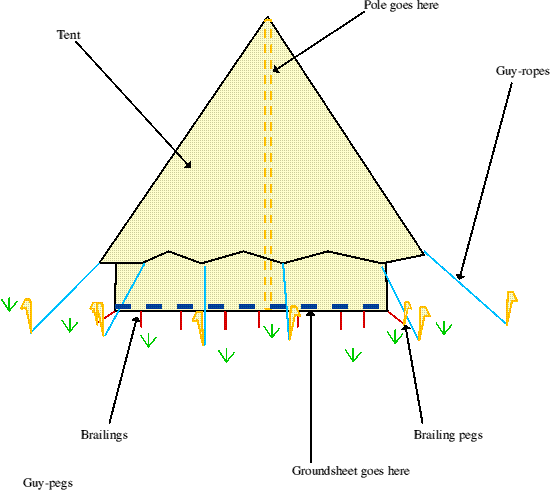
Fig. 1: Structure of a bell tent
In the week before the children come, he recruits a number of people who go and put up the camp. Obviously the first thing they need to do is put up tents (otherwise they'd have nowhere to sleep themselves): this is quite a difficult task as a number of different things need to be done, several of which involve a number of people. It is important that it is done quickly, however, as there are 6 bell-tents to be put up and they must be done then in case it starts to rain. I decided to see if critical path analysis could make the job any quicker.
I began by looking at what was actually involved in putting up a bell tent. I observed the three helpers at the camp putting one up, and noted what they did:
I used this to draw a table of the activities they performed, how many people each took and their approximate durations (in seconds). I also added in the immediate dependencies based on their activities[1]. This gave the following table:
| Activity | Name | Duration | People | Dependencies | |
| A | Fetch pole | 60 | 1 | - | |
| B | Fetch groundsheet | 60 | 1 | - | |
| C | Fetch tent | 120 | 1 | - | |
| D | Lay out groundsheet | 180 | 2 | A,B,C | |
| E | Put out 12 guy-pegs | 40 | 3 | D | |
| F | Assemble pole | 10 | 1 | E | |
| G | Take tent out of bag | 60 | 1 | F | |
| H | Unfold tent | 120 | 1 | G | |
| I | Insert pole into tent | 60 | 1 | H | |
| J | Raise tent | 120 | 3 | I | |
| K | Connect guys to pegs | 180 | 3 | J | |
| L | Put out brailing pegs | 40 | 3 | K | |
| M | Connect brailings to pegs | 120 | 3 | L | |
| N | Straighten groundsheet | 120 | 1 | M |
Using this table, I drew an activity network to find out which activities were critical:
Fig. 2: Activity network (critical activities are shown in red)
The last thing I needed before I could start analysing the situation was a cascade chart showing how many people each activity needed and the chain of dependencies inherent in the task. In order to create a comprehensible chart the activities on the chart must be ordered logically (i.e. activities after their dependencies) using cascade activity numbers (see MEI Decision and Discrete 1 page 104). I allocated CANs (cascade activity numbers) using the following algorithm:
This gave the following numbering:
| Activity | CAN |
| A | 1 |
| B | 2 |
| C | 3 |
| D | 4 |
| E | 5 |
| F | 6 |
| G | 7 |
| H | 8 |
| I | 9 |
| J | 10 |
| K | 11 |
| L | 12 |
| M | 13 |
| N | 14 |
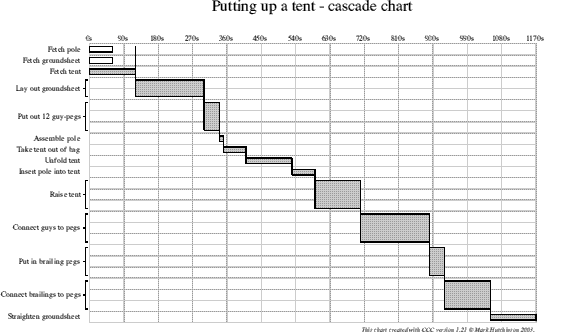
Having done this, I constructed a cascade chart (using a program I wrote myself, incidentally). This is figure 3, over the page. Solid lines show dependencies; dotted lines 'float' over activities and do not obstruct their path. The width of each activity depends on the number of people it requires; in this way the cascade chart can be used for resource levelling as well.
I now have all the information I need to see whether I can improve the efficiency of the team as they put a bell-tent up.

Fig. 3: Putting up a tent - cascade chart
It is quite easy to see from all three diagrams (the table, the activity network and the cascade chart) that the system currently in use is extremely inefficient. For a good deal of the time only one or two people are doing anything useful, whilst the long chain of critical activities means any delay would push everything on. I feel sure it can be rearranged to make it more efficient whilst introducing more slack time.
To do this I will need to make each person rather more independent, by seeing which jobs actually need doing before the process can continue. For example, the guy-ropes don't need putting out until the tent is going to be put up; however the tent must be fetched before it can be raised. I am also trying to lessen the number of people needed for a task where possible: pegs can be put out by fewer than three people though it will take a little longer. Thinking along these lines, I rewrote the dependencies in the following table:
| Activity | Name | Duration | People | Dependencies |
| A | Collect and put out 12 guy-pegs | 60 | 2 | - |
| B | Fetch tent | 120 | 1 | - |
| C | Fetch pole sections | 60 | 1 | - |
| D | Fetch groundsheet | 60 | 1 | - |
| E | Take tent out of bag | 60 | 1 | B |
| F | Lay out groundsheet | 180 | 2 | D |
| G | Assemble pole | 10 | 1 | C |
| H | Unfold tent | 120 | 1 | E |
| I | Insert pole into tent | 60 | 1 | G,H |
| J | Raise tent | 120 | 3 | F,I |
| K | Connect guy-ropes to pegs | 180 | 3 | A,J |
| L | Collect and put out brailing pegs | 60 | 2 | - |
| M | Connect brailings to pegs | 120 | 3 | K,L |
| N | Straighten groundsheet | 120 | 1 | M[2] |
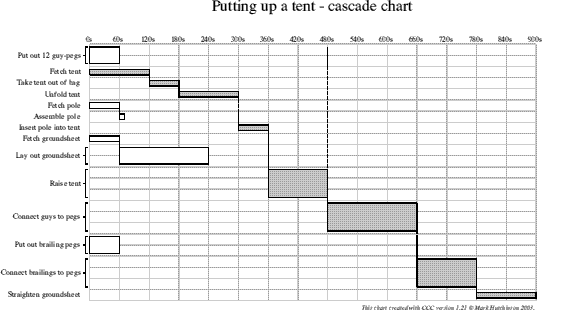
Using this table I can redraw the cascade chart and activity network to see how long an optimal solution to this task would take, but it is important to remember that at the moment this will not take into account how many people there are to do the task; that is, the optimal solution would likely require more than 3 people at some places. It is
Here is the new activity network and cascade chart.
Fig. 4: Activity network

Fig. 5: Cascade chart
As I expected, this solution requires too many people at some points, but with careful use of the float for non-critical activities (such as laying out the groundsheet) I can create a feasible solution which does not take much longer. The final solution I created is explained in the following table, showing what each person is doing at each stage in the task (horizontal lines mark points at which each person must have finished their job for the task to continue):
| Person A | Person B | Person C |
| Fetch tent | Put out guy-pegs | |
| Take tent out of bag | Put out brailing-pegs | |
| Unfold tent | Fetch groundsheet | Fetch pole |
| Assemble pole | ||
| Lay out groundsheet | Insert pole into tent | |
| Raise tent | ||
| Connect guys to pegs | ||
| Connect brailings to pegs | ||
| Straighten groundsheet | ||
This translates to the following activity network:
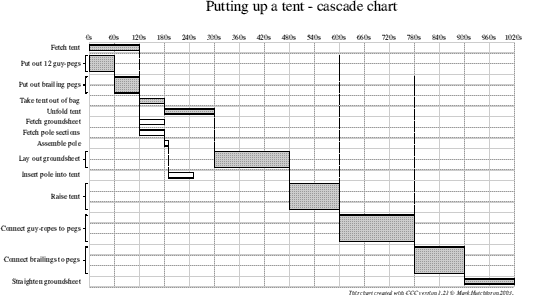
and the following cascade chart:

This has saved 21/2 minutes overall; this may not seem much, but over 6 tents the quarter of an hour could save the team from being caught out by bad weather (always a threat in England). There is also a significant amount more float among the non-critical activities, so a delay would be less likely to affect the process. As you can see, the efficiency of the task has been significantly improved merely by thinking about it in a more logical way, using effective resource allocation and arranging dependencies efficiently.
[1] Note that these may not turn out to be the real dependencies, as they could be waiting for no reason.
[2] Because the brailings hold the edge of the tent down to seal it, and straightening the groundsheet checks this.